We have got some good feedback and inquiries on the malware graphs and on how we make them.
The tools we use for reverse engineering malware are:
IDA the Interactive DisAssembler IDAPython, Python extension for IDA pydot, Python interface to Graphviz utilities
IDAPython and pydot are developed by us and released as open source.
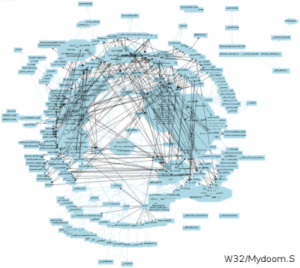
The graphs are done by exploring the code of a malware sample looking for all the functions and the relationships between them (who calls who). This information, together with text references, are then exported using pydot into a format that Graphviz utilities can read.
For more info, readers may be interested in a paper by us recently published in Virus Bulletin 2004 proceedings, the paper can be read here. On it we detail some of the tools and how we use them, together with interesting results on automatic malware classification.
Some readers also suggested we should create posters out of these graphs. We would like to ask you for your opinion: How many of you would be interested in such posters? Let us know by mailing us at .

 .
.